Na GitHubu se objevila rychlá javascriptová knihovna μPlot. Sto padesát tisíc bodů umí vykreslit za 135 milisekund.
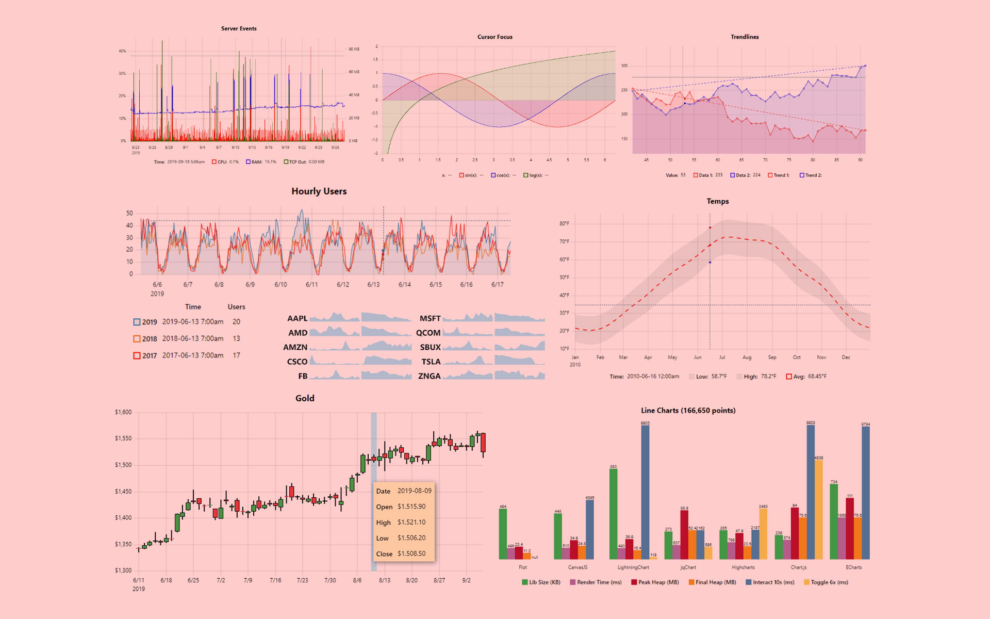
μPlot is a fast, memory-efficient Canvas 2D-based chart for plotting time series, lines, areas, ohlc & bars; from a cold start it can create an interactive chart containing 150,000 data points in 135ms, scaling linearly at ~3,300 pts/ms. In addition to fast initial render, the zooming and cursor performance is by far the best of any similar charting lib; at < 25 KB, it’s likely the smallest and fastest time series plotter that doesn’t make use of context-limited WebGL shaders or WASM, both of which have much higher startup cost and code size.
166,650 point bench: https://leeoniya.github.io/uPlot/bench/uPlot.html
However, if you’re looking for true real-time 60fps performance with massive datasets, uPlot can only get you so far. WebGL should still be the tool of choice for applications like realtime signal or waveform visualizations: Try danchitnis/webgl-plot or huww98/TimeChart.